Three Azure Cost Leaks - And the Analysis Process That Found Them
Background
This is the fifth post in a series on AI-augmented software engineering across the disciplines that matter most for production grade enterprise systems. The earlier posts covered ground that's probably more familiar with software engineering fraternity:
- Three Fintech Architecture Post-Mortems
- The GC Summary Report Wasn't Wrong
- Same JSON Storage Problem, Different Database
- A Black Friday Incident That Took 9 Days to Resolve
This post covers different ground - Cloud Cost Optimization. Every previous post dealt with something visibly broken - an alert firing, a query degrading, an app crashing. Cloud Cost problems don't usually announce themselves. They accumulate quietly in a billing dashboard that most engineering teams look at once a quarter, if at all!
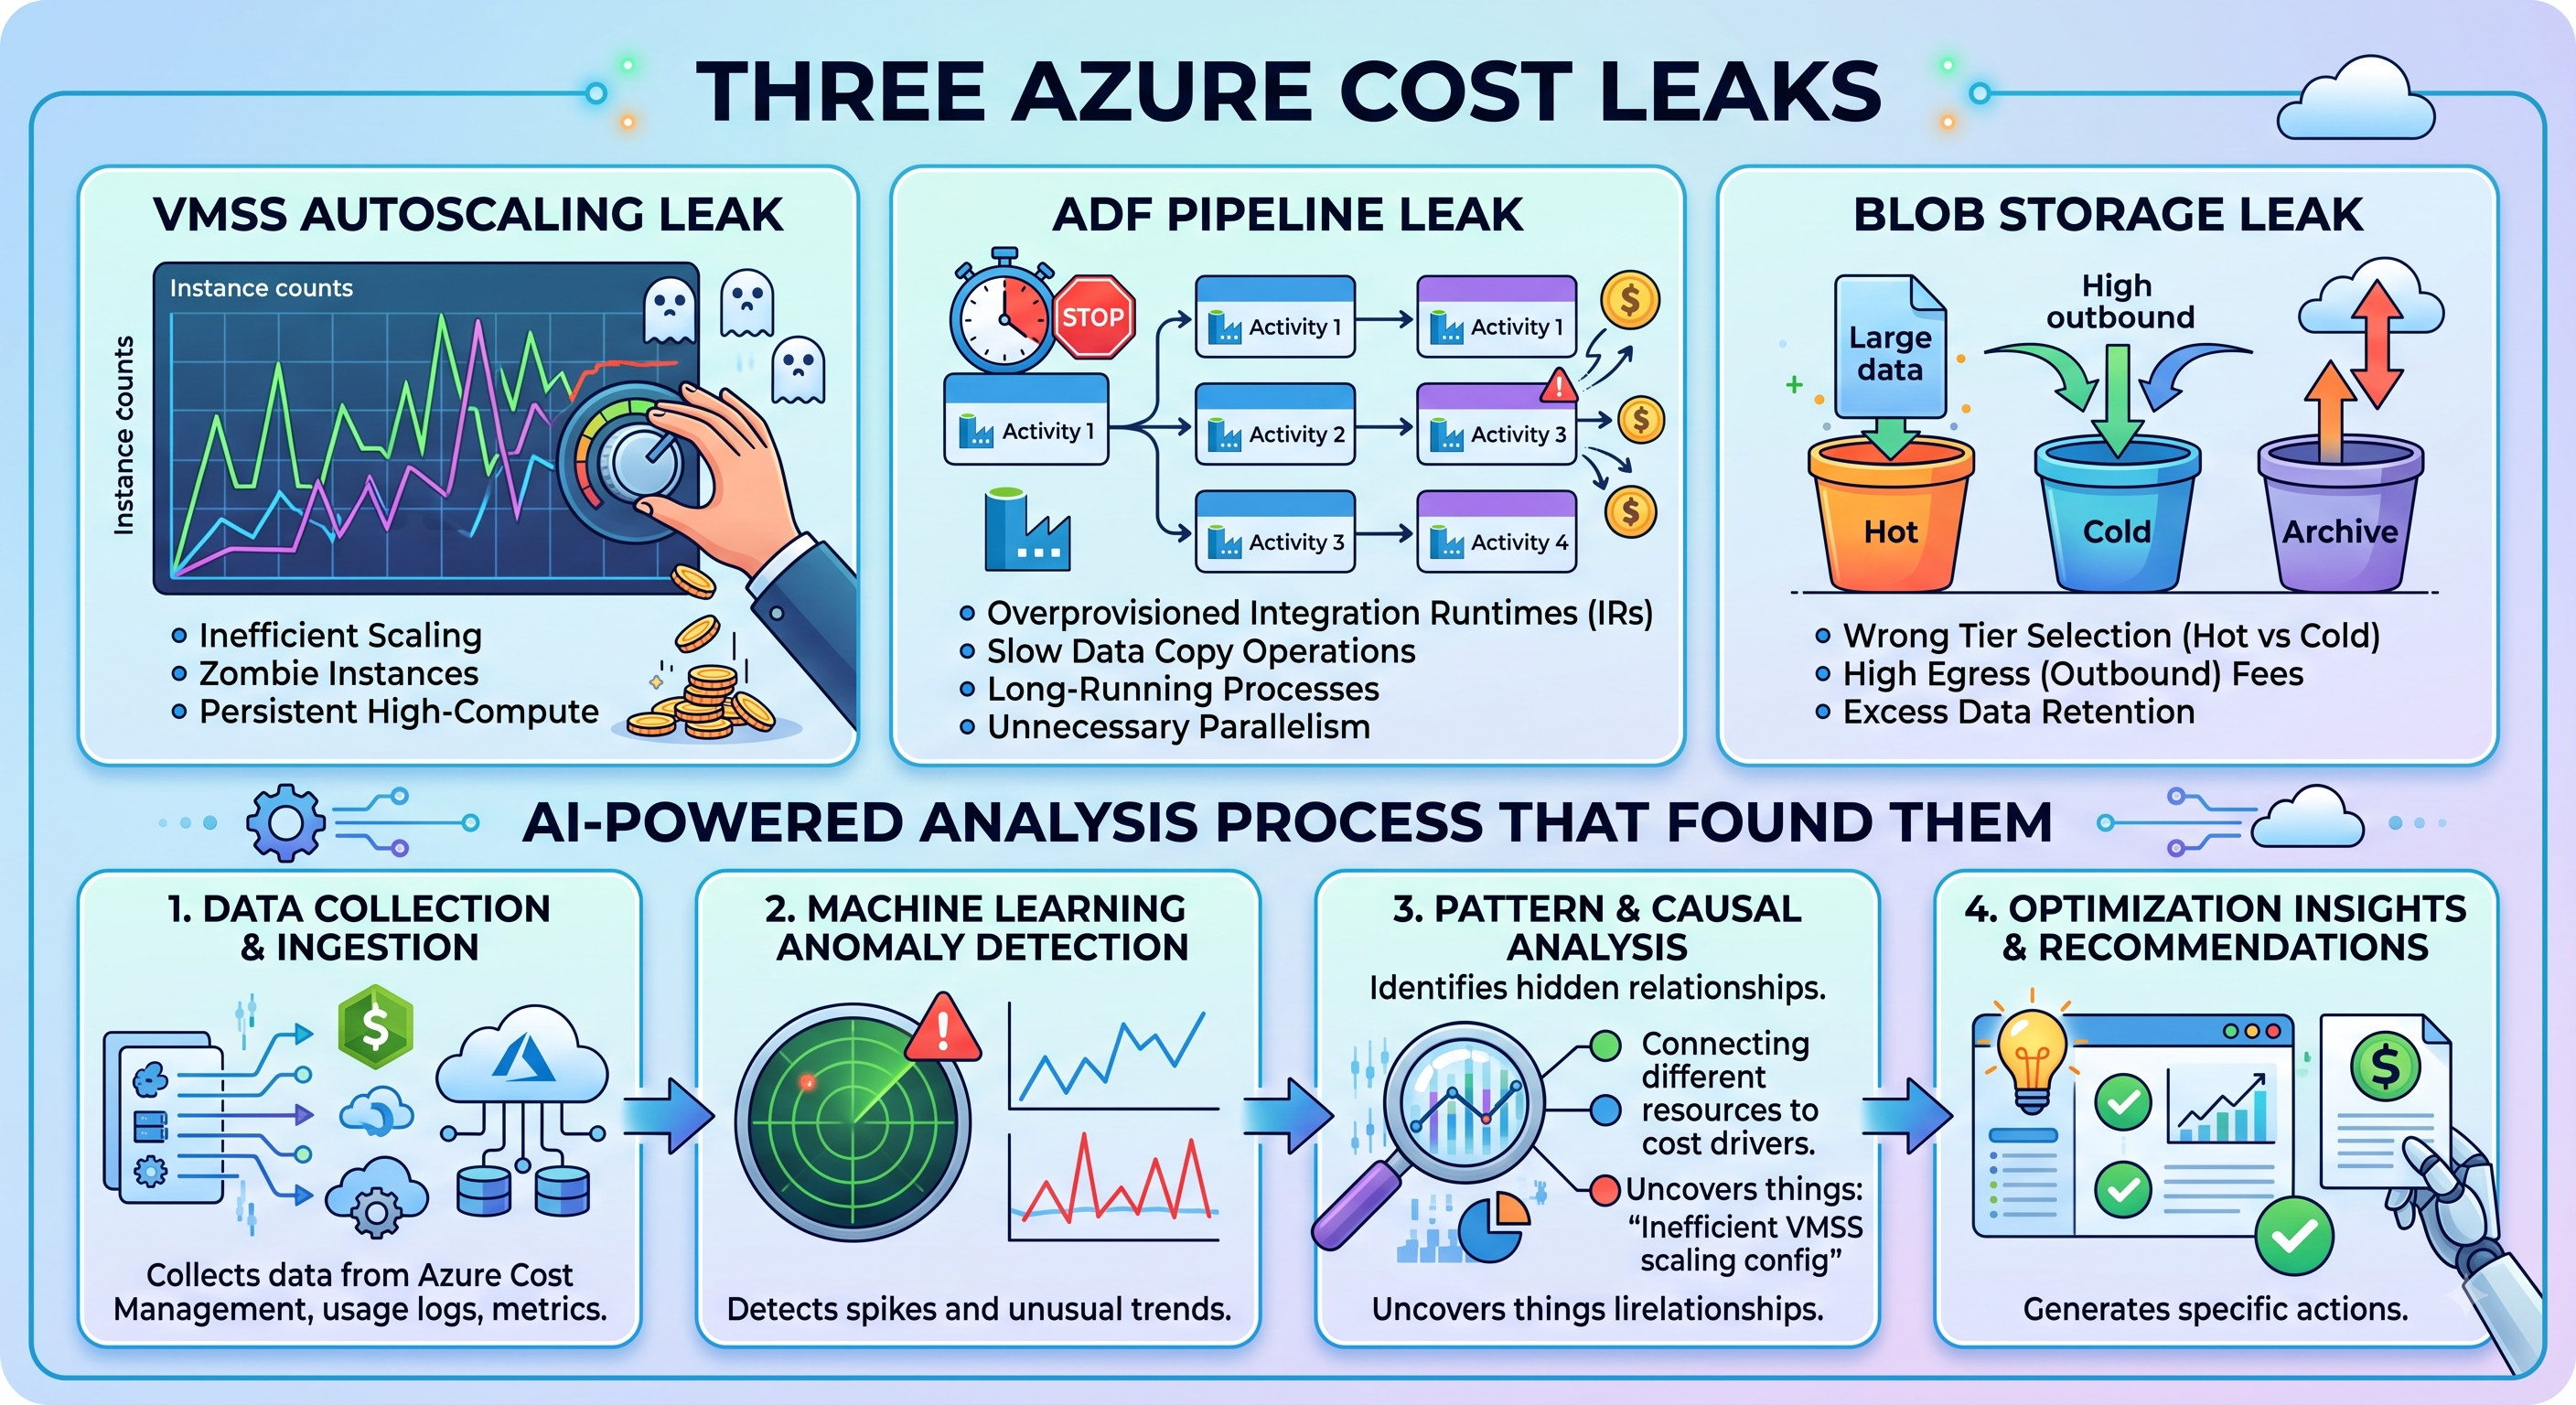
The three cost patterns in this post came from Azure infrastructure, where I was involved as Consultant in assessing and optimizing cloud bills - a VMSS-based payment API, an ADF pipeline moving data from on-premises to Snowflake via Blob Storage, and the staging layer between them. None of the decisions that created these cost patterns were wrong in isolation.
What's interesting about analysis is : the cost inefficiency is mainly due to the gap between a design decision and its cost at scale. The analysis process I'll walk through is less about finding mistakes and more about asking what does this decision actually cost, and is that cost proportional to the value it's delivering?
I'll cover three patterns, show the cost calculation for each, and share the structured prompt I used to work through each analysis systematically.
1. VMSS autoscaling - the instance that wasn't ready yet
The infrastructure: A VMSS- backed payment API processing 750+ TPS at peak, deployed on Standard_D4s_v3 instances (4 vCPU, 16GB RAM), autoscaling configured to trigger scale-out at 70% average CPU utilisation across the scale set.
The decision that made sense: 70% CPU was chosen as the trigger to give headroom before instances saturated. Scale out before you're in trouble. That's reasonable autoscaling philosophy.
The cost pattern it created: When a new instance came up, it had to go through a warm‑up cycle : Spring context initialization, cache loading, and connection pool setup - which took ~90 seconds before it could handle traffic properly. The VMSS health probe marked the instance as “healthy” as soon as it was alive, but that didn’t mean it was ready to take on full load.
What this meant in practice: when a CPU spike triggered scale-out, new instances joined the load balancer before they were ready to handle 750 TPS. Traffic hitting them too early caused slower responses. Meanwhile, the autoscaler saw high CPU (partly because the new instances were still warming up) and triggered yet another scale‑out. By the time everything had settled, the scale set was running 2–3 more instances than the workload really needed. And because of the cool-down period, those extra instances stayed online for another 10 minutes after the spike had passed.
The cost calculation:
 1Instance type:  Standard_D4s_v3
 2Hourly rate:    ~₹13.40/hr per instance (East US pricing, Pay-As-You-Go)
 3Over-provision: 2 extra instances × 10-minute cooldown overhang
 4                = 2 × (10/60) hrs per scale event
 5Scenario:       5 scale events per business day (peak traffic pattern)
 6
 7Extra cost per day:
 8  2 instances × (10/60) hr × ₹13.40/hr × 5 events = ₹22.33/day
 9
10Monthly:  ₹22.33 × 22 business days = ₹491/month
11
12At USD equivalent (~₹84/USD): ~$5.85/month
That number looks extremely small! But multiply it across a fleet of 8 VMSS applications with similar traffic and the same autoscaling mis‑calibration, and it adds up to about ₹3,928 a month (~$46.76) - just from cool-down waste. That’s before factoring in the extra scale‑out events triggered by cold‑start CPU spikes, which made the autoscaler think demand was higher than it really was.
What the analysis surfaced: The actual fix wasn’t lowering the CPU threshold. It was separating warm‑up time from scale‑out readiness. In practice, that meant replacing the default VMSS health probe with a custom readiness check that only reported “healthy” once the bootstrap sequence had finished, and shortening the scale‑out cool-down (since false scale events from cold‑start spikes would no longer happen).
The 70% CPU threshold itself was fine. The flawed assumption was that a new instance at 70% load would immediately add usable capacity. In reality, it needed time to warm up before it could carry its share of traffic.
2. ADF pipeline — paying for headroom that the data didn't need
The infrastructure: A daily ADF pipeline moving data from two sources - 300K CosmosDB documents and 1 million+ rows across CSV files in Blob Storage - transforming and loading into Snowflake. Integration Runtime configured with 32 Data Integration Units (DIUs).
The decision that made sense: The pipeline was set to run overnight, so 32 DIUs were picked to guarantee completion before business hours. More DIUs meant more parallelism, faster throughput, and a safer SLA. For a once‑daily batch with a hard deadline, this seemed to be a reasonable call.
The cost pattern it created: ADF charges by DIU‑hour per Copy Activity. At 32 DIUs, processing 300K CosmosDB documents and 1M CSV rows finished in about 45 minutes. The same workload at 8 DIUs - which aligns with Microsoft’s recommendation of 4–8 DIUs per TB for structured data - would take roughly 2.5 to 3 hours. Both options fit comfortably within the overnight window, but the higher DIU choice carried extra cost without delivering meaningful benefit.
The cost calculation:
 1ADF DIU pricing:     $0.25 per DIU-hour (standard IR, Azure region pricing)
 2Current config:      32 DIUs × (45 min / 60) = 32 × 0.75 = 24 DIU-hours per run
 3Optimised config:    8 DIUs × (2.5 hrs) = 8 × 2.5 = 20 DIU-hours per run
 4
 5Current monthly:     24 DIU-hours × $0.25 × 30 days = $180/month
 6Optimised monthly:   20 DIU-hours × $0.25 × 30 days = $150/month
 7
 8Saving: $30/month
 9
10But the actual saving is larger than this calculation suggests. At 32 DIUs, the copy activities scale-out linearly - CosmosDB read throughput and Blob Storage egress both have per-operation costs that scale with parallelism.
11
12CosmosDB read at 32 parallel readers: ~12,000 RU/s burst at peak
13CosmosDB read at 8 parallel readers:  ~3,000 RU/s sustained
14CosmosDB pricing:                      $0.008 per 100 RU/s per hour
15
16Monthly CosmosDB RU cost difference:
17  32 DIUs: 12,000 RU/s × $0.008/100 RU × 0.75hr × 30 = $21.60/month
18  8 DIUs:   3,000 RU/s × $0.008/100 RU × 2.5hr  × 30 = $18.00/month
19
20Total combined saving: ~$33.60/month
Again one pipeline cost equates to $33.60/month. Across a data platform with 12 daily ADF pipelines similarly over-provisioned: ~$403/month, or ~$4,836/year.
What the analysis surfaced: The right question wasn't "can we reduce DIUs?" Instead, it was "what is our actual overnight batch window, and how many DIUs do we need to complete within stipulated timeframe?"
Answer: window is 6 hours (midnight to 6am), the pipeline at 8 DIUs completes in under 3 hours. 32 DIUs was solving for speed you didn’t actually need. The business requirement was finish by 6 AM, not finish as fast as possible.
A secondary finding: the ADF pipeline was set to retry 3 times on failure with a 30-minute wait between retries. With 32 DIUs it not only costs more per run, it amplifies retry costs because:
- Each retry is expensive (24 DIU‑hours).
- High throughput makes retries more likely (due to throttling).
By right‑sizing to 8 DIUs, you:
- Reduce the base cost per run.
- Lower the chance of hitting 429 errors.
- Cut retry overhead when errors do occur.
In short: Over‑provisioning DIUs increases both direct costs and retry penalties. Optimizing DIUs aligns throughput with Cosmos DB’s capacity, making the system more stable and cheaper.
3. Blob Storage - the staging data nobody owns
The infrastructure: Azure Blob Storage used as an intermediate staging layer for an on-premises data warehouse migration to Snowflake. On-prem data extracted, landed in Blob Storage, picked up by Snowflake's external stage, loaded & confirmed.
The decision that made sense: keeping staging data after Snowflake load was never an explicit decision. It was an absence of a decision - no lifecycle policy, no cleanup job, no post-migration checklist that included "delete from staging after confirmed load." The data just accumulated.
The cost pattern it created: Six months of daily pipeline runs, each landing approximately 15GB of data (1M+ rows at average row size ~15KB). No cleanup. Storage tier: Hot (the default, chosen for pipeline reliability - you want the data accessible if a retry is needed).
 1Daily data landed:         ~15GB
 2Accumulation period:       180 days
 3Total staging data:        ~2.7TB
 4
 5Hot tier pricing (LRS):    $0.018 per GB per month
 6Monthly storage cost:      2,700GB × $0.018 = $48.60/month
 7                           (and growing by ~450GB/month as pipeline continues)
 8
 9What it should have been:
10  Keep data for 7 days (sufficient for retry window and confirmation)
11  Then delete or move to Archive tier
12
13At 7-day retention:        ~105GB at any time
14Monthly cost at Hot tier:  105GB × $0.018 = $1.89/month
15
16Monthly saving:            $46.71/month
17Annual saving if left:     $560.52/year (and growing as data accumulates)
The compounding problem: Hot tier storage doesn’t just charge for keeping data; it also charges for reads. Every time the pipeline scans the staging container to check for new files, it ends up touching all the objects inside - including months of old data that should have been cleared out long ago. At 2.7 TB, those list‑and‑check operations add up to extra egress and transaction costs on data that serves no purpose anymore.
What the analysis surfaced: The fix was surprisingly simple: a Blob Storage lifecycle policy. With one small JSON rule - no code, no extra infrastructure - data can automatically move from Hot to Cool after 7 days, and then to Archive or deletion after 30 days. Looking back, the oversight was obvious. When the pipeline was designed, the focus was on moving data, not on cleaning up the staging copy afterward. Nobody had asked the basic question: Who owns post‑migration cleanup?
4. The structured analysis process
Three cost patterns, three different root causes, one consistent observation: none of them were visible without asking a specific question about each resource.
The Azure Cost Management dashboard showed aggregate spend by resource group. It showed that VMSS, ADF, and Storage were the top three line items. It didn't show that VMSS was over-provisioning during cooldown, that ADF was using 4 times more DIUs than the data volume needed, or that Blob Storage was accumulating because of a missing lifecycle policy.
The framework I used for each review boiled down to five questions:
- What is this resource doing, and what’s the cost of running it the way it’s currently set up?
- Is the setup sized for real usage, or is it inflated by worst‑case assumptions that don’t match the data?
- What decision or oversight led to this configuration - and was cost ever part of that decision, or was it purely about operational safety?
- Based on actual usage, what’s the right‑sized configuration, and what would that cost look like?
- If we apply that right‑sizing, what number should show up in the next 30‑day cost report?
It’s the fifth question that makes the exercise practical instead of theoretical. A savings estimate that can’t be checked in the next billing cycle is just a guess. A number you can verify is a commitment - and that’s the difference between a FinOps recommendation and a FinOps engagement that closes.
The full prompt templates for each of the three analyses are in the FinOps Template.
Conclusion
Three infrastructure components. Three cost patterns. Total combined saving across one platform: approximately $80/month, or ~$960/year.
Unremarkable at the scale of a single platform. Patterns that repeat across every Azure deployment in an organisation - VMSS autoscaling everywhere, ADF pipelines sized conservatively across a data platform, staging containers without lifecycle policies - and the number becomes meaningful quickly.
The more important observation: none of these findings required a dedicated FinOps tool or a specialist. They required someone asking "what does this configuration actually cost relative to what it's doing?" against each resource that appeared as a significant line item in the billing dashboard. That's replicable without new tooling, which is the point.
P.S. — All the templates used across analysis of this & previous 4 articles are available in the se-ai-templates repository on GitHub.
comments powered by Disqus