Linux tools for analyzing System Performance

Background
In today's contemporary world of enterprise software where massively used applications are expected to scale and run seamlessly at extreme high loads e.g. Scaling Hotstar for 25.3 million users, system performance becomes one of the key tenant of architecting high throughput, low latency applications along with capability of ease in scaling as per business / end consumer needs .
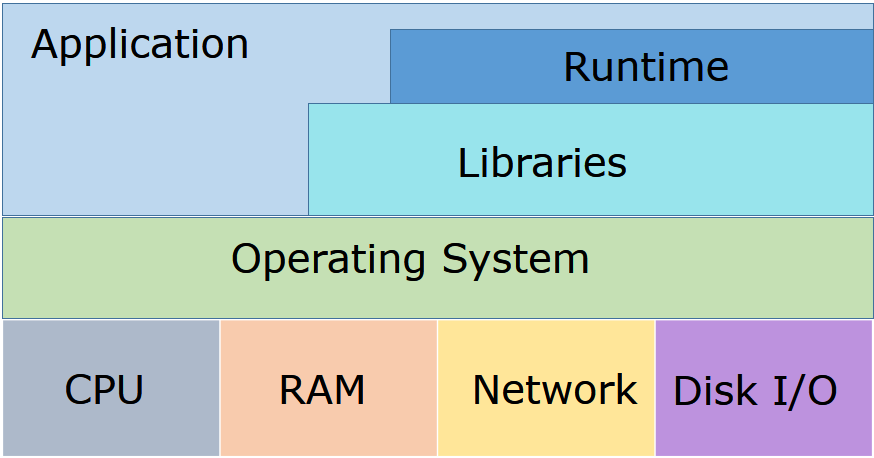
System performance is a very broad term as it would encompass entire gambit of computer system i.e. all the software and hardware components that comes within the path of a user request. In this article I will be mainly covering key tools to analyze system resources -
- Four main logical components of a physical computer - CPU, RAM, Networking, and Disk I/O
- Operating System
CPU
CPU is mainly responsible for executing all software and are most often probable hot spot for system performance issue. Key Linux tools that can help in finding deeper insights -
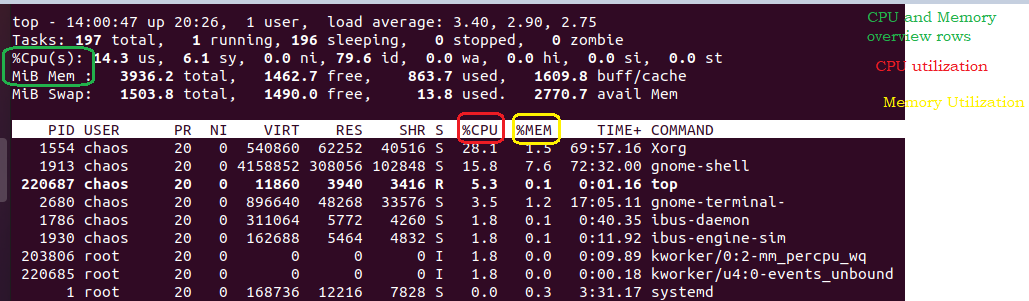
top
Shows top CPU consuming processes along with its CPU usage
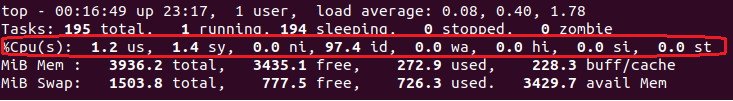
Above numbers pertaining to CPU utilization means -
- us (user time)—The percentage of time the CPU spent in user space.
- sy (system time)—The percentage of time the CPU spent in kernel space.
- ni (nice time)—The percentage of time spent on low-priority processes.
- id (idle time)—The percentage of time the CPU spent doing literally nothing. (It can’t stop!)
- wa (I/O wait time)—The percentage of time the CPU spent waiting on I/O.
- hi (hardware interrupts)—The percentage of time the CPU spent servicing hardware interrupts.
- si (software interrupts)—The percentage of time the CPU spent servicing software interrupts.
- st (steal time)—The percentage of time a hypervisor stole the CPU to give it to someone else. This kicks in only in virtualized environments.
Niceness
It mainly indicates how happy a process is to give CPU cycles to other more high priority process i.e. how nice it is with others :) Allowed values range from -20 to 19
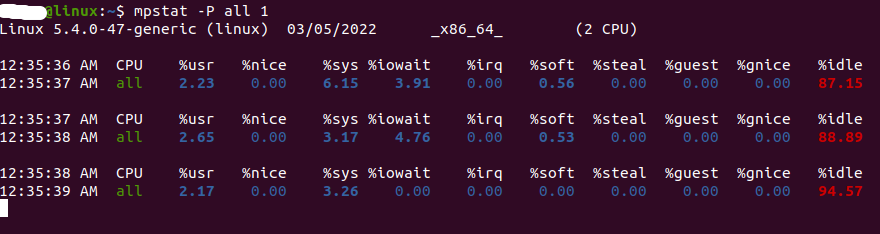
mpstat
Its multi processor statistics tool tha can emit metrics per CPU. It is similar to top but with load split separately for each processor.
Note
When your application slows down considerably due to other background processes than one may use niceness property to set higher relative property for application process. This has major limitation, as it does not control how much CPU to allocate to the process In order to overcome above limitation one can use control groups which mainly allows user to specify exact magnitude of resources i.e. CPU, Memory, I/O that kernel should allocate to group of processes
RAM
RAM determines the operating capacity of a system at any given time. Read speed of RAM determines two things -
- How fast your CPU can load data into its cache
- How much of system performance drops when CPU is forced to read from RAM instead of from its cache
Key Linux tools that can provide deeper insights -
free
It shows utilization of RAM.
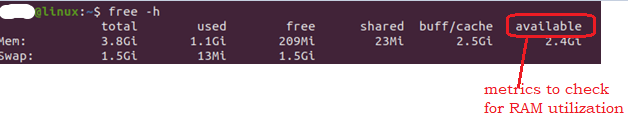
'Available' column as shown above is a key metric to check RAM utilization
top
It gives an overview of the memory along with CPU utilization (as discussed in previous section) of system. By default, the output is sorted by the value of field %CPU utilization of process
vmstat
It mainly emits virtual memory statistics

Key fields to understand from performance standpoint :
- r -> Indicates no. of processes running / waiting to run which implicitly helps us to know the saturation level of the system
- b -> Indicates no. of processes
- in -> Total no. of interrupts
- cs -> Total no. of context switches
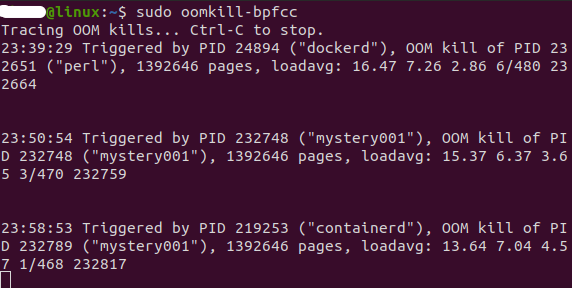
oomkill-bpfcc
It basically works by tracing oom_kill_process and emitting information whenever out of memory happens. In order to leverage this utility, open a terminal and execute below command and keep the terminal open.
1 sudo oomkill-bpfccWhenever OOM occurs below output can be seen
Network
With Distributed Systems, network plays a huge role in System Performance. Typically speaking network would mainly comprise of -
- Hardware - which would mainly include routers, NIC, switches etc
- Software - which would mainly include OS kernel that may comprise of device drivers, protocols etc.
Note - At software level, protocols can be further categorized into 2 :
- Protocols at kernel level i.e. TCP, UDP etc
- Protocols at application level i.e. HTTP One can refer my older posts w.r.t application level protocols and ways to optimize it -
- Blocking HTTP client via Spring's RestTemplate
- Reactive HTTP client via Spring's WebClient
- RSocket Vs Webflux
Key tools that can help in gaining kernel level metrics
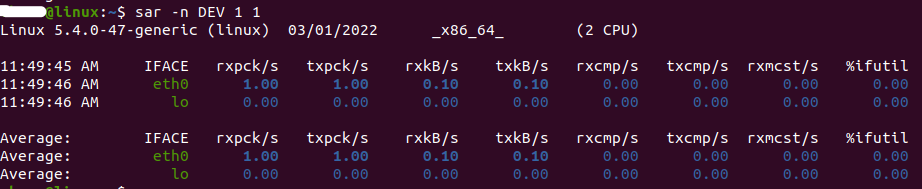
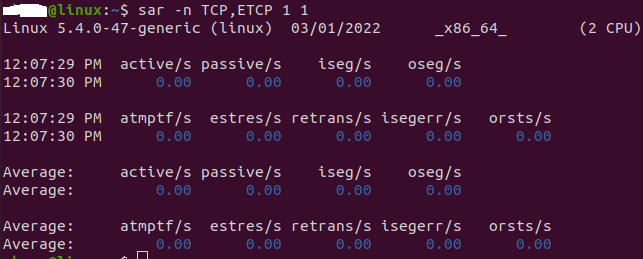
sar
It is a tool to collect system metrics
Activate sar
Edit the file /etc/default/sysstat by changing ENABLED from "false" to "true" and then restart its service by below command
1 sudo service sysstat restartsar options and its metrics understanding
Various options provided by Linux version -
- -n DEV: Network interface statistics
- -n EDEV: Network interface errors
- -n TCP: TCP statistics
- -n ETCP: TCP error statistics
- -n SOCK: Socket usage
- -n IP: IP datagram statistics
- -n EIP: IP error statistics
tcptop
It is a tool that emits TCP throughput by host and its processes
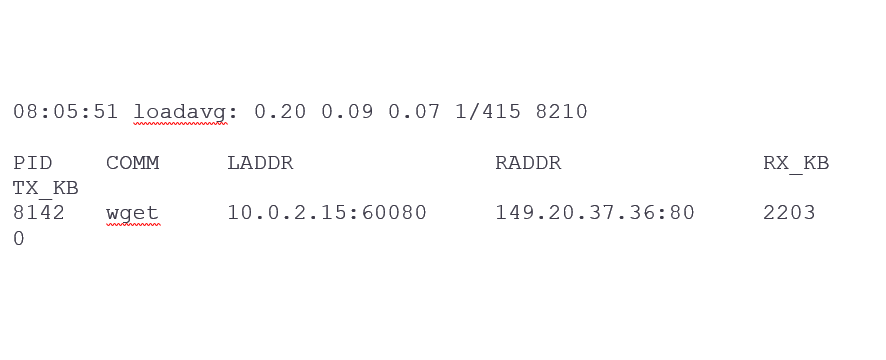
- RX_KB : Received traffic in KB
- TX_KB : Traffic sent in KB
Disk I/O
Disk I/O can have huge impact on system performance and this in turn may lead to high latency of application. A very common scenario that might lead to performance issues - System is waiting for Disk I/O to get completed and as a result CPU is idle due to blocking I/O operation
Key tools that can help in gaining kernel level metrics
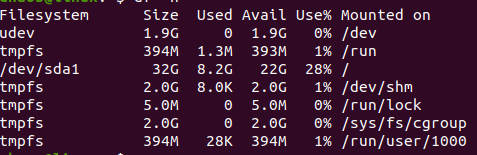
df
It mainly shows all the file systems mounted along with its size and used space
iostat
Emits summary of I/O statistics per disk
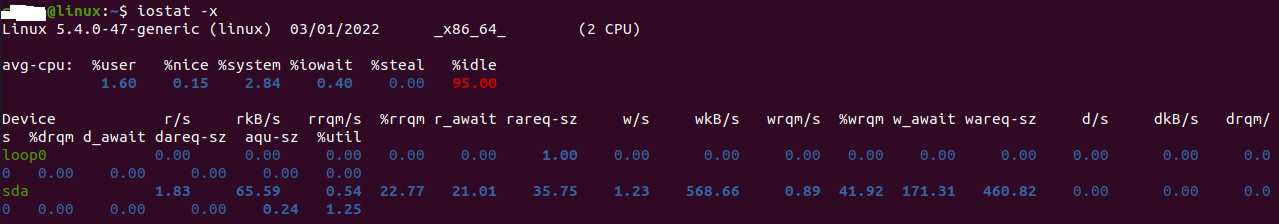
Note -
- Use -x to get extended metrics
- Few key metrics to understand the throughput / avg size of read/write - r/s, w/s, rKb/s, rKb/s
- aqu-sz : Measurement of saturation which indicates queue length of requests
- %util : Indicates utilization i.e. percentage of time device spent doing some work. A high value may indicate saturation
biotop
Emits summary of disk I/O by process
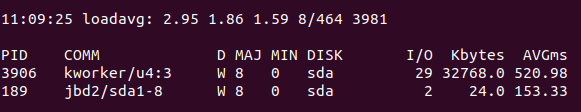
It mainly helps to identify source of load being written to disk is coming from. It in a way helps to identify the root cause of high consumption of resources
Operating System
Operating System is a program on which application along with its binaries runs. It also manages system along with hardware, CPU, memory etc.
Few tools that can help to get key metrics -
opensnoop
Allows you to see all the files being opened by all the processes on your system, in almost near to real time
1 sudo opensnoop-bpfccexecsnoop
It list of all the processes being started on the machine by listening for call to exec variant in the kernel
1 sudo execsnoop-bpfccOther handy Linux tools from Performance Engineering standpoint
Uptime
It mainly indicates -
- how long system has been up
- average load on the system which mainly helps in understanding the pattern (increasing or decreasing load)
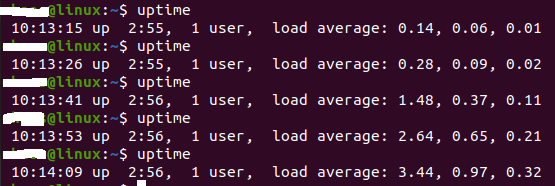
Note:
- The three numbers in Load Average represent a moving window sum average of processes competing over CPU time to run over 1, 5, and 15 minutes. The numbers are exponentially scaled, so a number twice as large doesn’t mean twice as much load
- If the numbers are decreasing sharply, it might mean that the program which was eating up all the resources has already completed its execution
- Increasing number would mostly indicate rising load on the system
Exit code of applications
One can return exit code returned by previous command
1 echo $?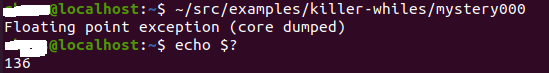
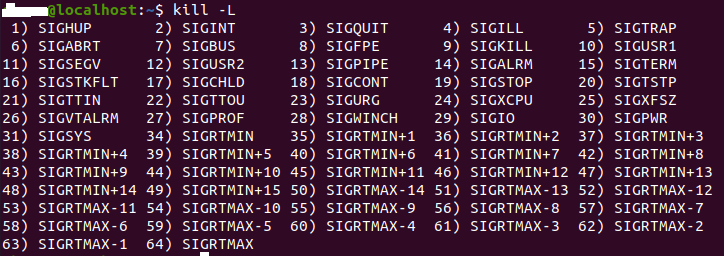
Note - codes in range 128-192 are decoded by using 128 + n, where n is the number of the kill signal
Quick check on memory and CPU utilization
1 top -n1 -o+%MEM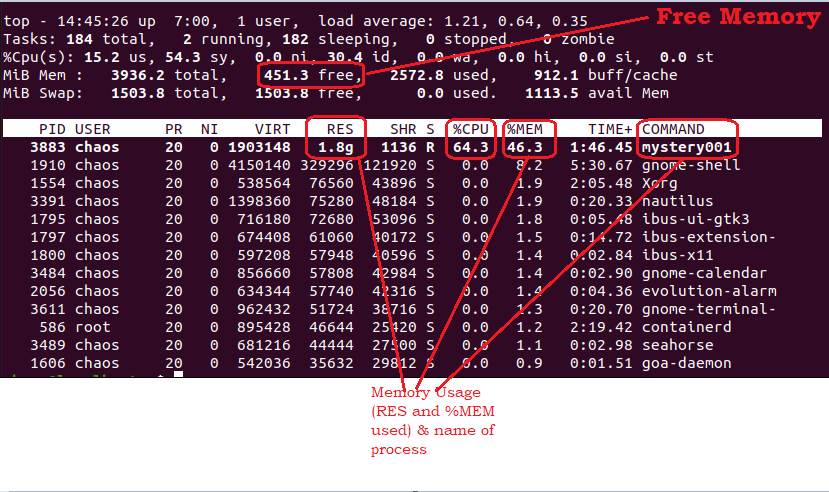
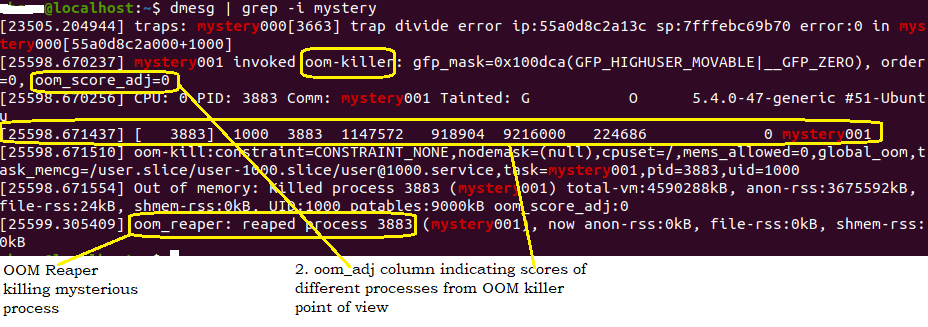
dmesg
Linux utility that displays kernel messages
misc-dmesg
Conclusion
Architecting and developing low latency, high throughput enterprise applications needs an overall understanding of not only software but also about the underlying OS behavior along with its key components viz. CPU, RAM, Network and Disk. In this article I tried to show how quickly one can use some of the commands to get insights from OS level whilst troubleshooting performance issues.
P.S : List of commands and their output shown above are based on Chaos Engineering
comments powered by Disqus