A Black Friday Incident Took 9 Days to Resolve - Here's the Process That Would Have Changed That
Background
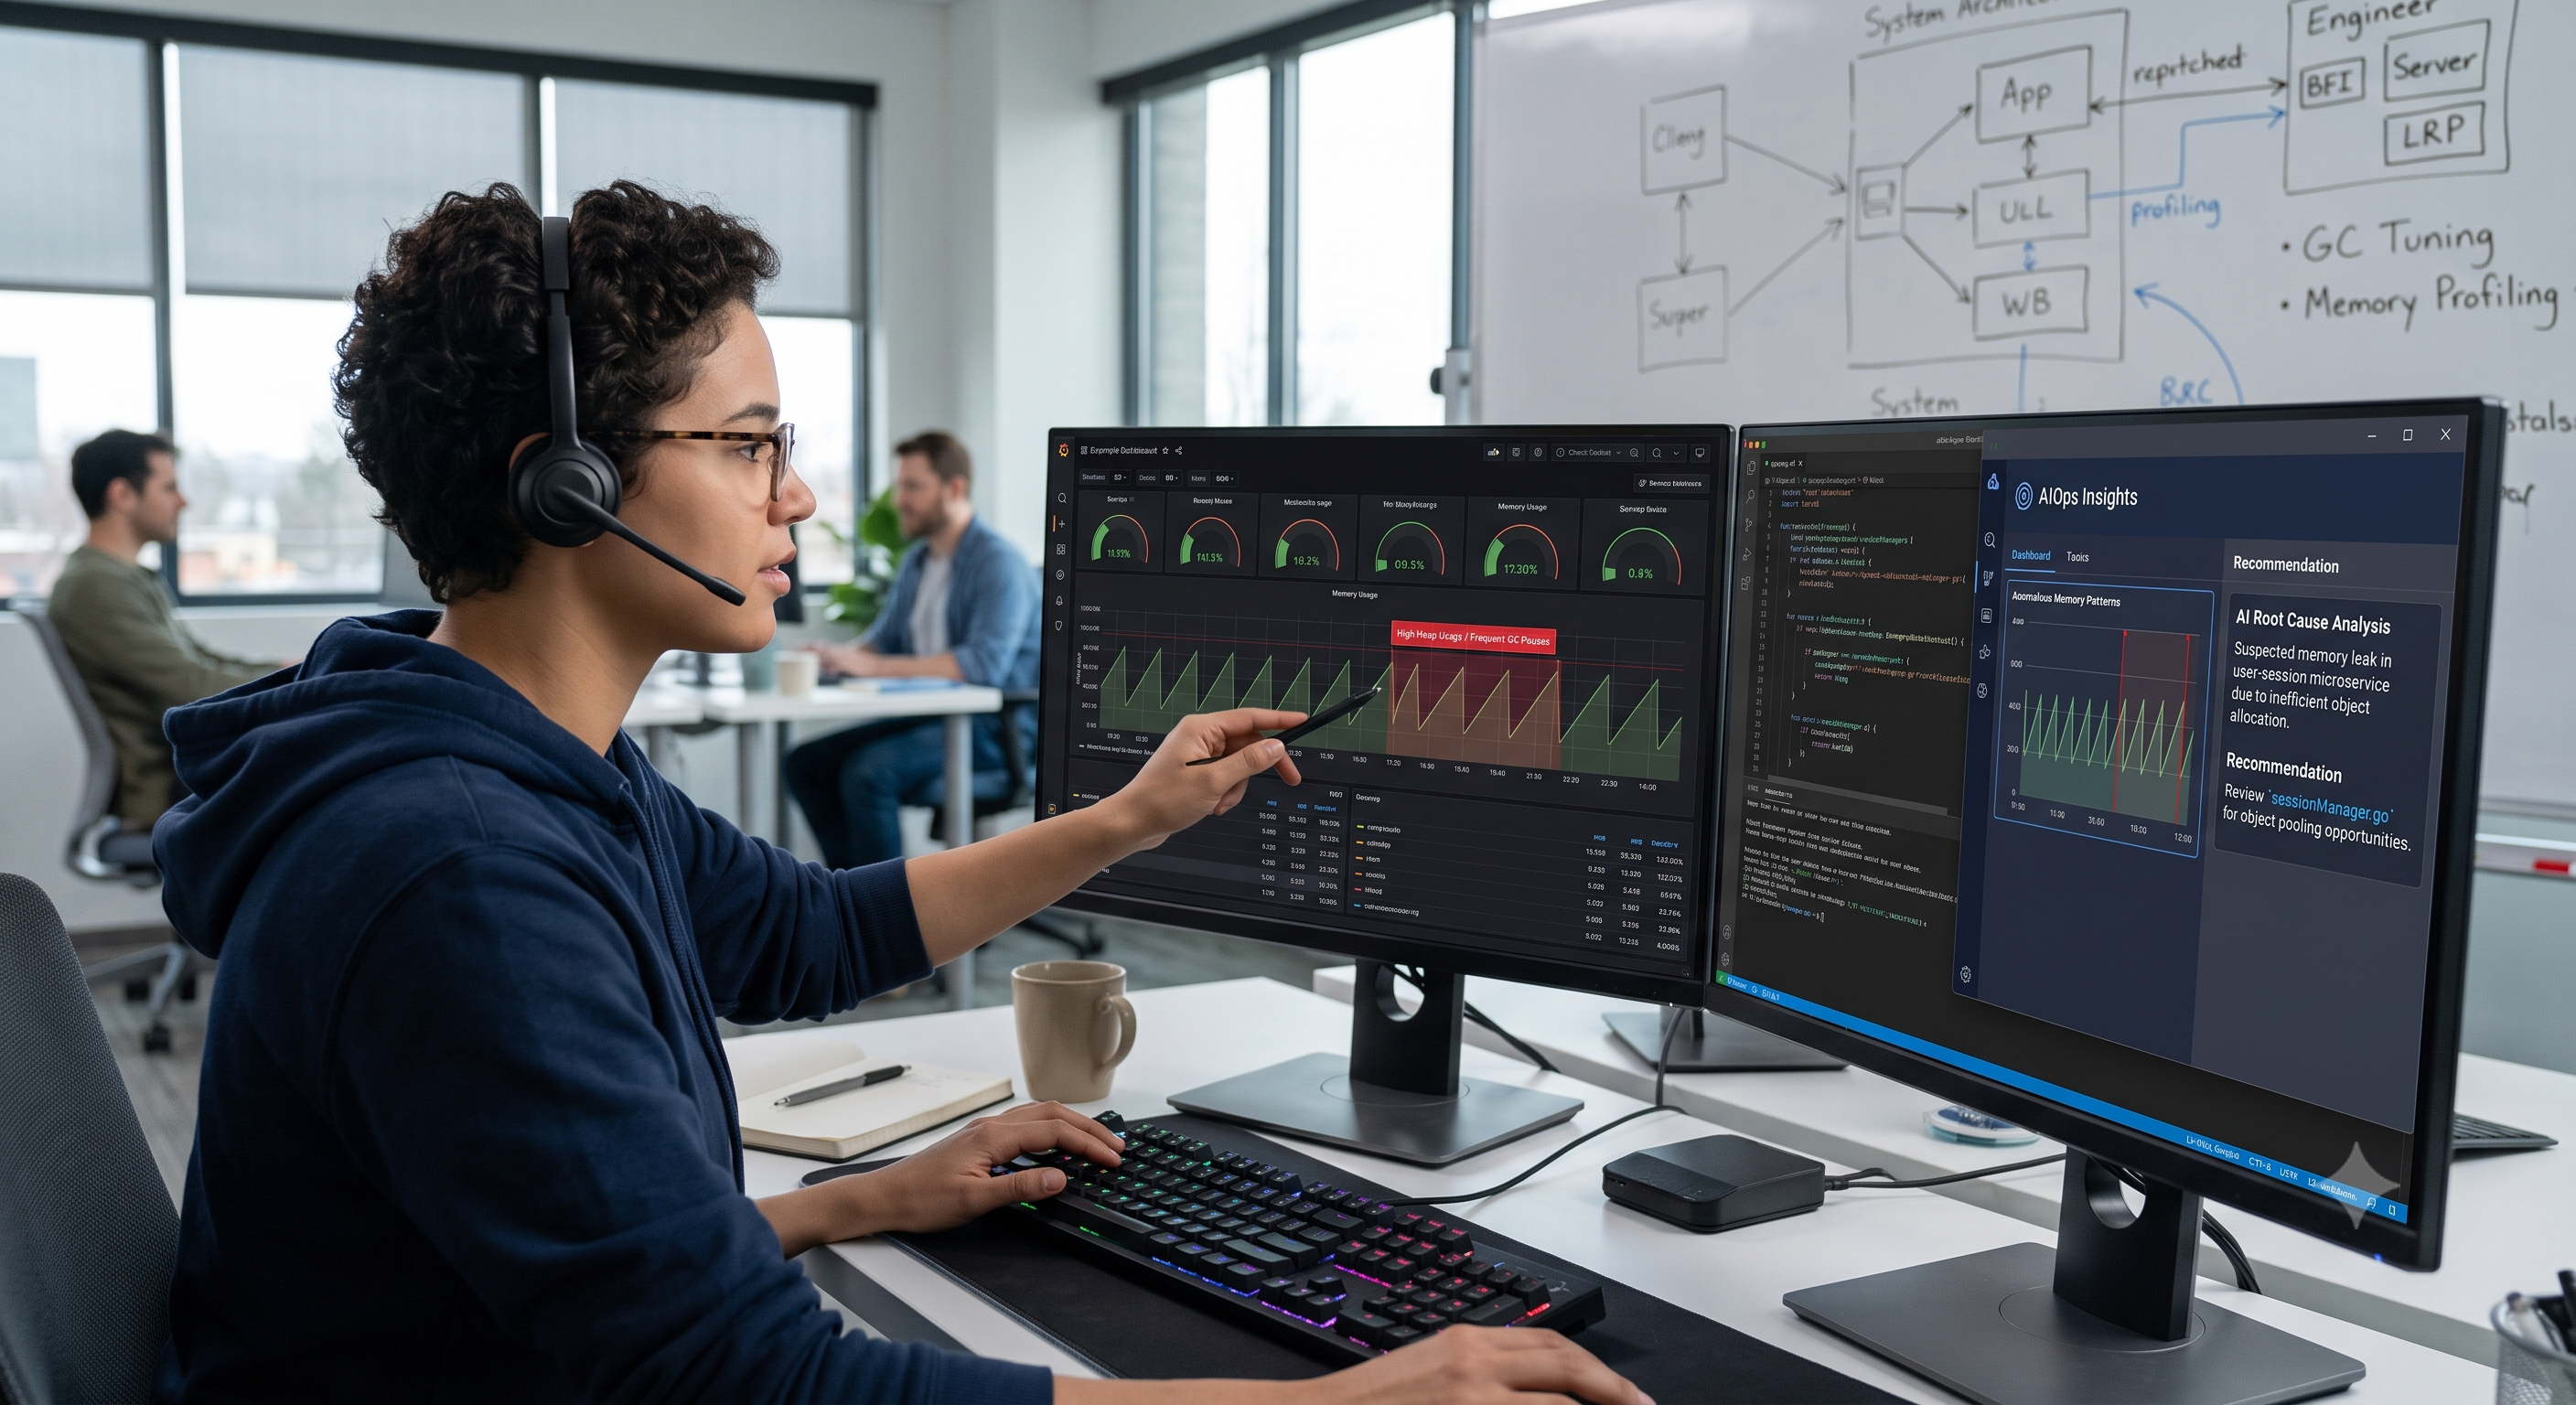
An older post on this blog covered the technical details of this incident - the GC types, the flags, the before-and-after metrics. This post covers something different: the process of how the investigation ran, where it lost time, and which decisions (with more structured approach) would have changed.
The incident
On Black Friday, an online checkout platform running at over 1000 TPS. CPU spiking to 100%, application crashing. Restarted every 12 hours to keep the business running while the team investigated. GC logs requested reactively from the ops team after the incident had already started.
Total investigation time
Roughly 9 days across two phases :
- Phase 1 - Identifying the GC algorithm as the problem and applying what looked like a fix - took 5 to 6 days.
- Phase 2 — Realising the fix was incomplete and tuning the right parameters - took another 3 to 4 days.
Neither of those timelines reflect lack of engineering skill. They reflect a process that didn't ask the right questions at the right moments. That's a different kind of problem, and it's worth examining in this world of AI.
What the investigation actually looked like
Day 1: CPU at 100% correlated with GC activity on Dynatrace. App crashes. Decision made to restart every 12 hours rather than leave it degraded. GC logs requested from the ops team.
Days 2-5: GC logs analyzed. Application running on Parallel GC - the default for JDK 8. High allocation failure rate (~90%). Investigation concluded: the GC algorithm is the problem; CMS is better suited for latency-sensitive applications. This conclusion was correct.
Days 5-6: CMS deployed to lower environment. Results looked good:
- 50% reduction in allocation failures
- 84% reduction in max pause time
Decision made to push to production.
Day 6, production: CMS in production showed a 17-second max GC pause. Old Generation fully occupied. The application was behaving worse than it had under Parallel GC in some respects, despite the lower environment showing clear improvement.
Days 7-9: Back to analysis. Research into CMS-specific JVM flags across documentation and technical blogs. Three parameters identified and applied after multiple runs:
UseCMSInitiatingOccupancyOnly=trueCMSInitiatingOccupancyFraction=70ParallelGCThreads=8
Final result: 95% reduction in max GC pause, 84% reduction in average pause, Old Gen consumption down 53.5%, throughput up 2.5%. Problem resolved.
Where the investigation lost time
At three specific points. All of them required a more structured set of questions.
Point 1 — the first day diagnosis was shallow.
Seeing CPU at 100% correlated with GC on a dashboard tells you the application has a GC problem. It doesn't tell you which GC phase is responsible, and that distinction matters for choosing the right fix.
Parallel GC causes stop-the-world pauses on both Young and Old generation collections. CMS eliminates most of the Old generation stop-the-world pauses, but adds CPU overhead from its concurrent mark and sweep phases running alongside application threads. If the CPU spike was primarily from concurrent GC threads competing with application threads, CMS wouldn't reduce the CPU load - it would change its shape.
The investigation correctly identified that CMS was the right algorithm for a latency-sensitive workload. But it didn't diagnose which phase of Parallel GC was dominating CPU, which would have surfaced the real question earlier: is the problem the algorithm, or is it what the algorithm is being asked to do with the available heap?
Point 2 — the lower environment didn't test the right conditions.
CMS showed a 17-second max pause in production because of how CMS triggers its Old Generation collection. By default, CMS uses JVM heuristics to decide when to start a sweep - and those heuristics allow Old Gen to fill significantly before acting. At staging load, Old Gen never reached the occupancy level where the heuristics became a problem. At 1000+ TPS on Black Friday, it unfortunately did.
The lower environment result - 50% improvement in allocation failures, 84% improvement in max pause - was real. It just wasn't measuring the right thing under the right conditions. Nobody asked: "Under what heap occupancy level does this fix break? Does our lower environment reach that occupancy level?"
That question wasn't obvious to ask in that moment. It's the kind of question that belongs on a checklist before any fix goes from staging to production.
Point 3 — the parameter value was borrowed, not derived.
CMSInitiatingOccupancyFraction=70 came from reading Oracle JDK 8 documentation and technical blogs. It worked. But the right way to arrive at that value is to look at the actual Old Gen consumption rate visible in the production GC log - how fast was Old Gen filling between collections? - and calculate a threshold that gives the concurrent sweep enough time to complete before Old Gen reaches capacity.
If the production GC log showed Old Gen filling at, say, 15% per minute at peak load, and a CMS sweep takes roughly 30 seconds, then you need to trigger the sweep when Old Gen has at least 7-8% headroom remaining. That's a calculation, not a lookup. The documentation gives you the parameter; the GC log gives you the value.
Arriving at 70 by research rather than calculation meant spending 3-4 days testing different values rather than starting from a principled estimate.
The three questions a structured process would have asked
Each of these maps to a point in the investigation where the right question would have changed the direction or reduced the timeline.
At hour 1 — before choosing a fix:
"What does CPU-correlated-with-GC tell us about which specific GC phase is consuming CPU — and does that tell us whether the problem is the algorithm choice, the heap configuration, or the application's allocation behavior?"
This question separates "GC is using CPU" (which CMS could help) from "GC is using CPU because the heap is too small for this workload" (which CMS alone wouldn't fix — and didn't, initially).
Before pushing the fix to production:
"Under what heap occupancy conditions would this fix behave differently in production than it did in the lower environment - and does our lower environment reproduce those conditions?"
This question would have surfaced the CMS heuristic problem before day 6.
At the parameter tuning stage:
"Given the Old Gen consumption rate visible in the production GC log, what is a principled starting estimate for CMSInitiatingOccupancyFraction - and what would I expect to see in the next GC capture if that estimate is right?"
This question would have anchored the 3-4 day parameter search to a starting value based on measurement rather than documentation.
What a structured approach changes - and what it doesn't
Worth being direct about both.
What it changes:
The first question, asked on day 1, probably doesn't shorten phase 1 by 5 days. GC analysis takes time regardless of how well the questions are structured. But it might have surfaced the heap occupancy issue before the CMS push to production - which would have made phase 1 end differently, without the 17-second pause surprise.
The second question, asked before the production push, almost certainly avoids phase 2 as a separate investigation. The CMS heuristic problem is a known, documented behaviour. Asked directly, it surfaces immediately. Phase 2 - 3 to 4 days — collapses to a configuration change.
The third question shortens the remaining parameter search to a principled starting point rather than a documentation sweep.
What it doesn't change:
GC log analysis still requires human judgment. The right value of CMSInitiatingOccupancyFraction for this specific application isn't something any external process can calculate without the production GC log data. The structured questions point you toward the calculation; they don't replace it.
More importantly: a structured process doesn't replace reactive instrumentation with proactive instrumentation. The GC logs in this incident were requested on day 1 after the incident started. A structured incident response runbook that specifies "GC logs must be pre-enabled in production before any major traffic event" would have saved at least half a day of log collection time. That's an operational process change, not a question-asking change.
The full prompt templates for all three decision points - the hour-1 symptom analysis, the pre-production fix validation, and the parameter derivation prompt - are in the GitHub repo below.
Conclusion
A 9-day Black Friday incident isn't a story about missing technical knowledge. The team knew what GC was, knew what CMS was, knew how to read a GC report. The knowledge was there. What wasn't there was a set of questions - asked at the right moments - that would have prevented the investigation from advancing past a partially-diagnosed problem.
The first fix was architecturally correct and operationally incomplete. That's a specific failure mode, and it's a common one. Any sufficiently complex system has the property that a fix can pass lower-environment testing and still fail in production, because the lower environment doesn't reproduce the right conditions at the right scale.
The structured questions above don't guarantee a faster resolution. They do guarantee that the investigation doesn't advance past "the fix passed staging" before asking whether staging was actually testing the right thing.
P.S. — The three prompt templates used across this analysis - the hour-1 symptom correlator, the fix validation checklist, and the GC parameter derivation prompt - are available in the se-ai-templates repository on GitHub.
comments powered by Disqus