Chaos Engineering – Demonstration with working example (Part-2)
Background
From first part of blog we gathered understanding about basics of Chaos Engineering. Now we will further deep dive to understand how to perform Chaos Engineering with a working example - which to me is going to be quite interesting. First lets start with understanding basics of working example which will be used to demonstrate following-
- How to perform chaos engineering within an application
- How to monitor the behavior of the system
- What to monitor whilst executing experiments on our system
Bird's eye view of demo example
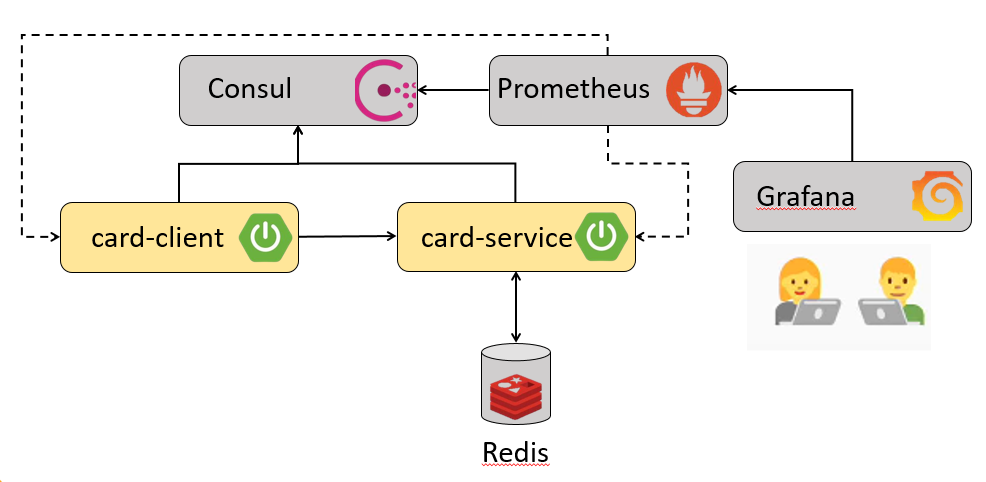
The working example (along with its source code) which we will be using for demonstration, primarily consists of 2 simple Spring Boot applications -
- Card Client - Public facing edge application
- Card Service - Application which has core domain of card. Since it owns business workflow, it will be using Redis as persistent store. It also has a bulk loader which will load 5000 cards into the database whenever it bootstraps.
To keep things simple, both the applications will just expose 2 APIs
- Get Card by Id - Returns a card for the corresponding id
- Get All Cards - Returns list of 5000 cards
Since Card Service is a core domain application, we will be quite curious to know how will Card Client behave if
- Card Service is either down
- Card Service is responding too slowly
Hence we will be performing chaos engineering experiments with Card Service application as blast radius.
As per my earlier post, most fundamental prerequisite for performing Chaos Engineering experiments is to have state of the art Monitoring available in order to understand system behavior by capturing required metrics. This is the key as it will help in identifying vulnerable areas of system which needs to be further hardened. So in order to enable required monitoring stack we will need some additional infrastructure components as mentioned below -
- Consul - It is a service mesh solution providing features like service discovery, health check, secure service communication etc
- Prometheus - It is an open source monitoring and alerting tool built by SoundCloud
- Grafana - It is a visualizing tool that allows us to view different types of metrics by formulating queries and alerts. It has an excellent looking aesthetic UI.
Note - You can refer to my older blog for understanding how Spring Boot's Actuator, Micrometer, Prometheus and Grafana works in unison to provide us required system metrics.
In order to generate chaos we will inject failures and for that we will make use of some tool. As on date there are myriad tools available in market viz. Chaos IQ, Gremlin, Simian Army etc. Since we need to inject failures within application, we will be using Chaos Monkey for Spring Boot (CM4SB)
Internals of Chaos Monkey for Spring Boot (CM4SB)
At a high level Chaos monkey for Spring Boot basically consists of **Watchers **and Assaults.
Watchers
It will basically scan Spring Boot app for specific annotation (as per the configured values). It supports all the Spring annotation -
- @Controllers
- @RestControllers
- @Service
- @Repository
- @Component
By using AOP, CM4SB will identify the public method on which configured assaults need to be applied. One can even customize behavior of Watcher by using _watchedCustomService _property and thereby decide which classes and their public methods need to be assaulted
Assaults
They are the most important component of CM4SB. They are basically categorized into -
- Latency Assault - Adds latency to the request. Number of requests can be controlled by level
- Exception Assault - Enables throwing of RuntimeException as per the configured value
- Appkiller Assault - Shuts down the application. The only caveat with this assault is, once the application is shut down, it needs manual step to restart the application.
Metrics Emitted by CM4SB
| Type of Metric | Metric name |
|---|---|
| Chaos Monkey metric request count | chaos_monkey_application_request_count_total chaos_monkey_application_request_count_assaulted chaos_monkey_assault_component_watcher_total chaos_monkey_assault_controller_watcher_total chaos_monkey_assault_repository_watcher_total chaos_monkey_assault_restController_watcher_total chaos_monkey_assault_service_watcher_total |
| Chaos Monkey metric latency count in ms | chaos_monkey_assault_latency_count_gauge chaos_monkey_assault_latency_count_total |
| Chaos Monkey metric exception | chaos_monkey_assault_exception_count |
Note - We will be viewing each of this metric via Grafana dashboard as we perform chaos engineering experiments with our working example
Key implementation aspects
1. Adding Maven Dependency
1<dependency>
2	<groupId>de.codecentric</groupId>
3	<artifactId>chaos-monkey-spring-boot</artifactId>
4	<version>2.0.2</version>
5</dependency>
2. Activate Chaos Monkey for Spring Boot and Watcher related properties within application configurations
 1spring:
 2  profiles:
 3    active: chaos-monkey
 4
 5chaos:
 6  monkey:
 7    watcher:
 8      component: false
 9      controller: false
10      repository: false
11      rest-controller: true
12      service: true
3. Enabling Chaos Monkey endpoints for monitoring
 1management:
 2  endpoints:
 3    web:
 4      exposure:
 5        include: \["\*"\]
 6  #        include: \["info", "health", "prometheus", "chaosmonkey"\]
 7  metrics:
 8    tags:
 9      application: ${spring.application.name}
10    distribution:
11      percentiles:
12        http.server.requests: 0.5, 0.9, 0.95, 0.99
13
14  endpoint:
15    chaosmonkey:
16      enabled: true
List of HTTP Endpoints
| HTTP URI | Description | HTTP Method |
|---|---|---|
| /chaosmonkey | Running Chaos Monkey configuration | GET |
| /chaosmonkey/status | Is Chaos Monkey enabled or disabled? | GET |
| /chaosmonkey/enable | Enable Chaos Monkey | POST |
| /chaosmonkey/disable | Disable Chaos Monkey | POST |
| /chaosmonkey/watcher | Running Watcher configuration. NOTE: Watcher cannot be changed at runtime, they are Spring AOP components that have to be created when the application starts. | GET |
| /chaosmonkey/assaults | Running Assaults configuration | GET |
| /chaosmonkey/assaults | Change Assaults configuration | POST |
Demonstration of working example
Once we have our both the applications i.e. Card Client and Card Service along with Consul, Prometheus and Grafana up and running, we can inject failure using CM4SB. For monitoring CM4SB metrics, we have imported Grafana Dashboard with id as 9845. Before initiating chaos engineering experiments lets understand current configurations of Chaos Monkey by invoking '/actuator/chaosmonkey' with HTTP GET method
 1{
 2    "chaosMonkeyProperties": {
 3        "enabled": false
 4    },
 5    "assaultProperties": {
 6        "level": 5,
 7        "latencyRangeStart": 1000,
 8        "latencyRangeEnd": 3000,
 9        "latencyActive": true,
10        "exceptionsActive": false,
11        "exception": {},
12        "killApplicationActive": false,
13        "frozen": false,
14        "proxyTargetClass": true,
15        "proxiedInterfaces": \[\],
16        "preFiltered": false,
17        "advisors": \[
18            {
19                "order": 2147483647,
20                "advice": {},
21                "pointcut": {
22                    "classFilter": {},
23                    "methodMatcher": {
24                        "runtime": false
25                    }
26                },
27                "perInstance": true
28            }
29        \],
30        "targetSource": {
31            "target": {
32                "level": 5,
33                "latencyRangeStart": 1000,
34                "latencyRangeEnd": 3000,
35                "latencyActive": true,
36                "exceptionsActive": false,
37                "exception": {},
38                "killApplicationActive": false
39            },
40            "static": true,
41            "targetClass": "de.codecentric.spring.boot.chaos.monkey.configuration.AssaultProperties"
42        },
43        "exposeProxy": false,
44        "targetClass": "de.codecentric.spring.boot.chaos.monkey.configuration.AssaultProperties"
45    },
46    "watcherProperties": {
47        "controller": false,
48        "restController": true,
49        "service": true,
50        "repository": false,
51        "component": false
52    }
53}
As we can see from above response, it mainly depicts key configurations pertaining to Chaos Monkey for the corresponding Spring Boot application -
- Is Chaos Monkey for Spring Boot enabled
- Assault Configurations for Latency, Exception and Kill Application
- Watcher Configurations which mainly indicates Spring annotations on which configured assaults will be applied
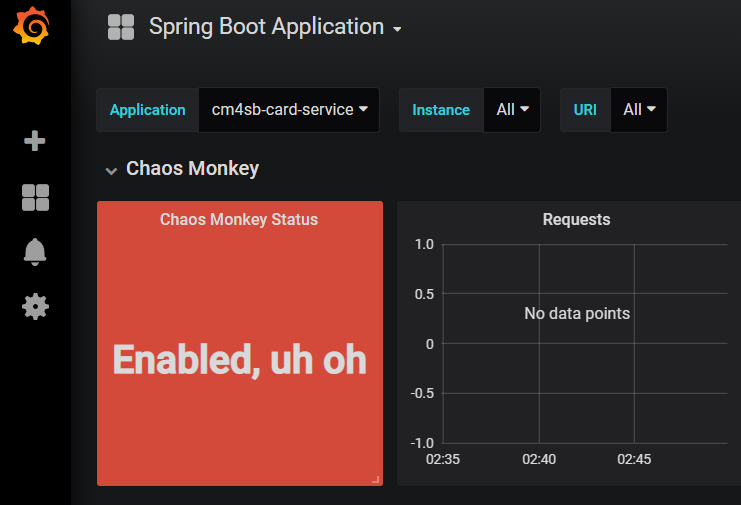
Next we need to enable Chaos Monkey. So we will be using '/actuator/chaosmonkey/enable' URI. As soon as it is enabled, we can clearly see it in Grafana dashboard (under 'Chaos Monkey Status') as shown below
First Chaos Experiment
As part of the first experiment, we will be generating chaos by applying Latency Assault via '/actuator/chaosmonkey/assaults' URI. Latency induced will be ranging from 4 - 7 seconds with level configured as 5. Request payload for configuring assault related settings will be as shown below
1{
2"level": 5,
3"latencyRangeStart": 4000,
4"latencyRangeEnd": 7000,
5"latencyActive": true,
6"exceptionsActive": false,
7"killApplicationActive": false,
8"exception": {
9 "type": "java.lang.IllegalArgumentException",
10 "arguments": \[{
11 "className": "java.lang.String",
12 "value": "custom illegal argument exception"}\] }
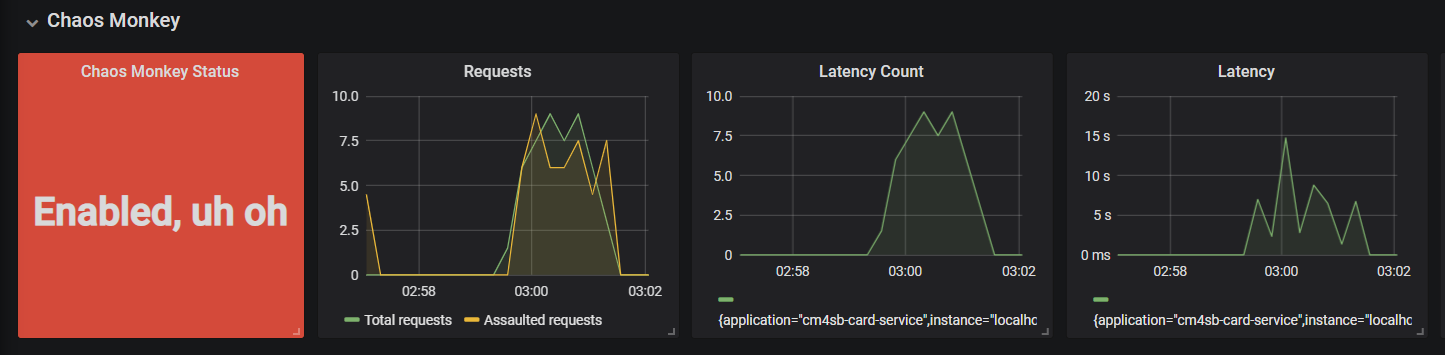
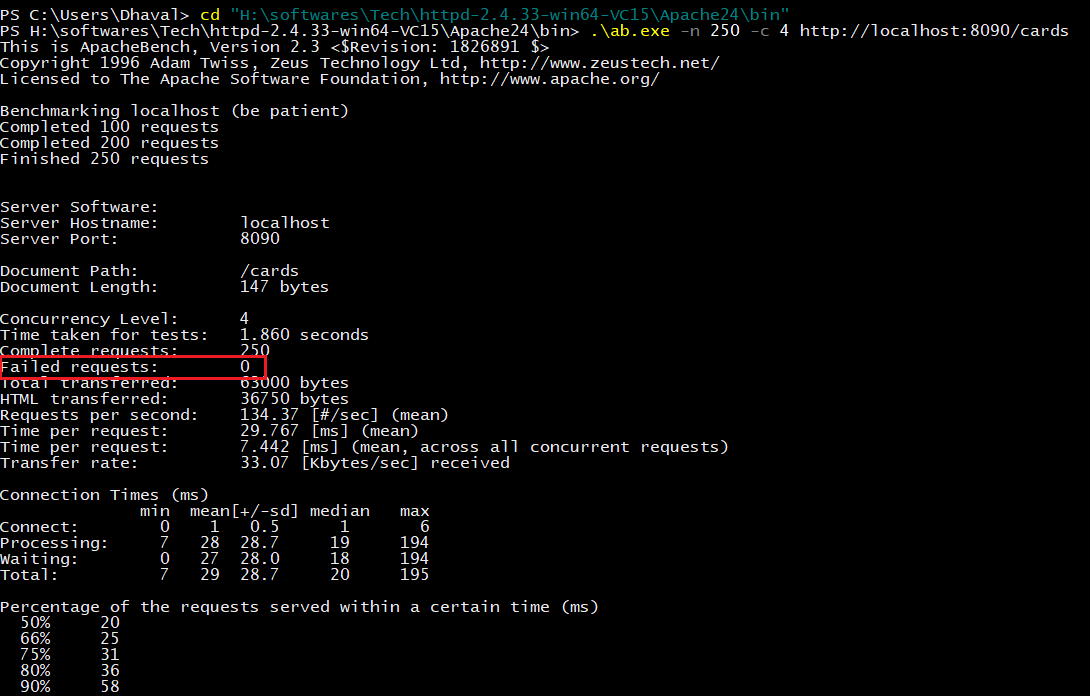
13}After running 250 requests with 4 concurrent threads for fetching all cards using Apache Bench
1> ./ab.exe -n 250 -c 4 http://localhost:8090/cards
we can clearly see below metrics within the imported dashboard
- Total number of incoming requests for Card Service application (as per selected time frame)
- Total number of requests for which latency was induced
- Actual latency induced (in seconds)
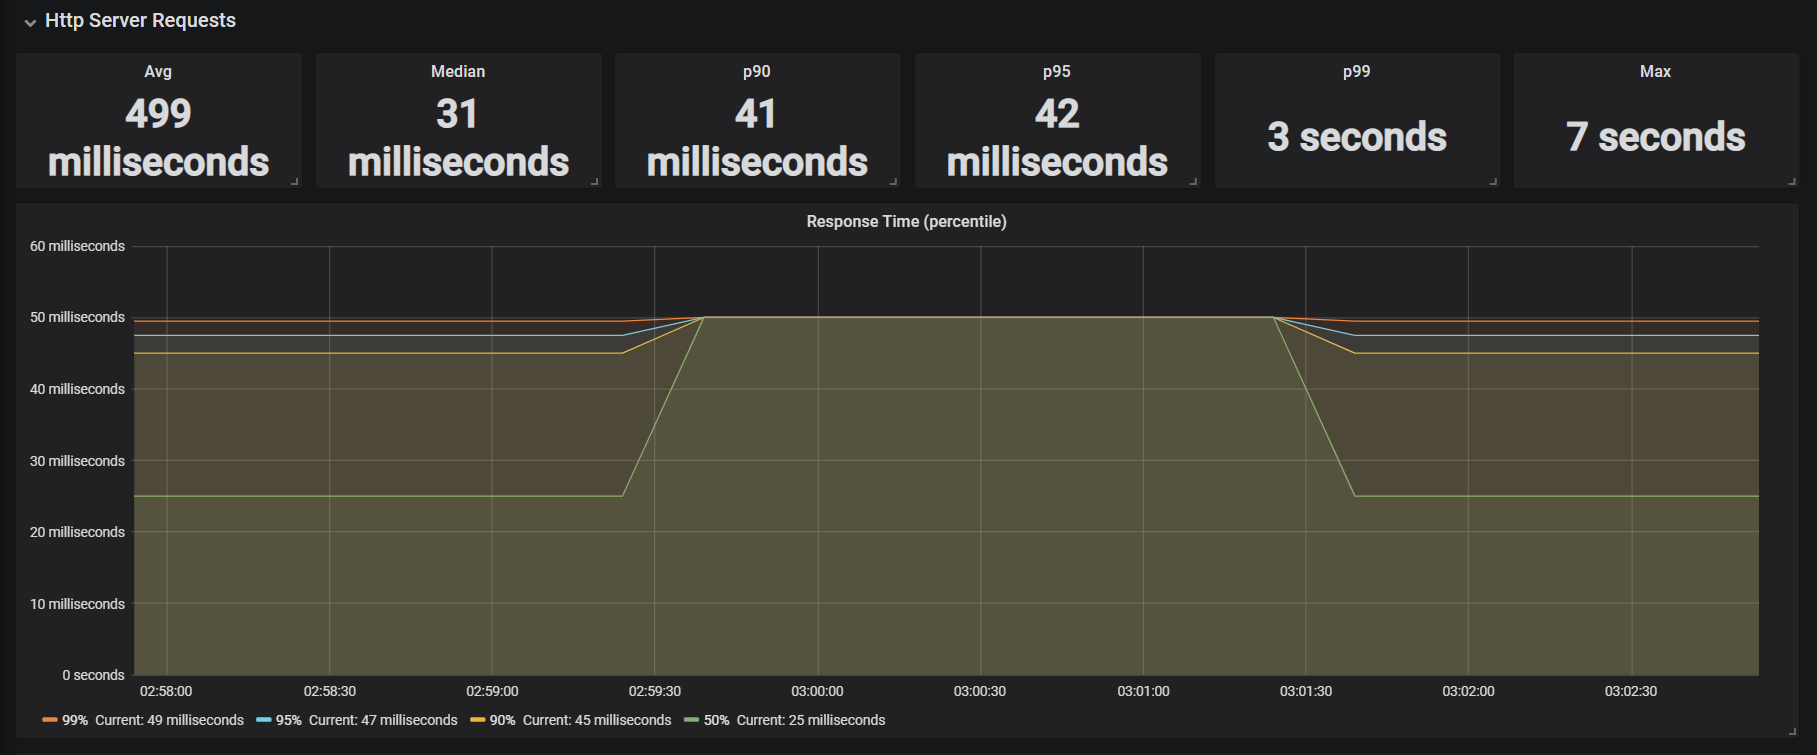
Since we have also configured distribution percentiles for server request we can also see metrics pertaining to response time. As we can see from below metrics, that response time of Get all Cards API is taking 7 seconds.
Second Chaos Experiment
As part of this experiment we will be applying Exception Assault to understand Card Client behavior in case Card Service ends up with Runtime exceptions. So we will modify the assault configuration by applying below request payload with same URI as above i.e. '/actuator/chaosmonkey/assaults'
 1{
 2"level": 5,
 3"latencyRangeStart": 4000,
 4"latencyRangeEnd": 6000,
 5"latencyActive": false,
 6"exceptionsActive": true,
 7"killApplicationActive": false,
 8"exception": {
 9    "type": "java.lang.IllegalArgumentException",
10    "arguments": \[{
11      "className": "java.lang.String",
12      "value": "custom illegal argument exception"}\] }
13}
After running the same tests (i.e. Fetch all Cards using the same above Apache Bench command) we can clearly see metrics within Exception Section of dashboard (as shown below). What we are able to see here is
- Total number of requests received by Card Service app
- Number of exceptions thrown
- Error Rate
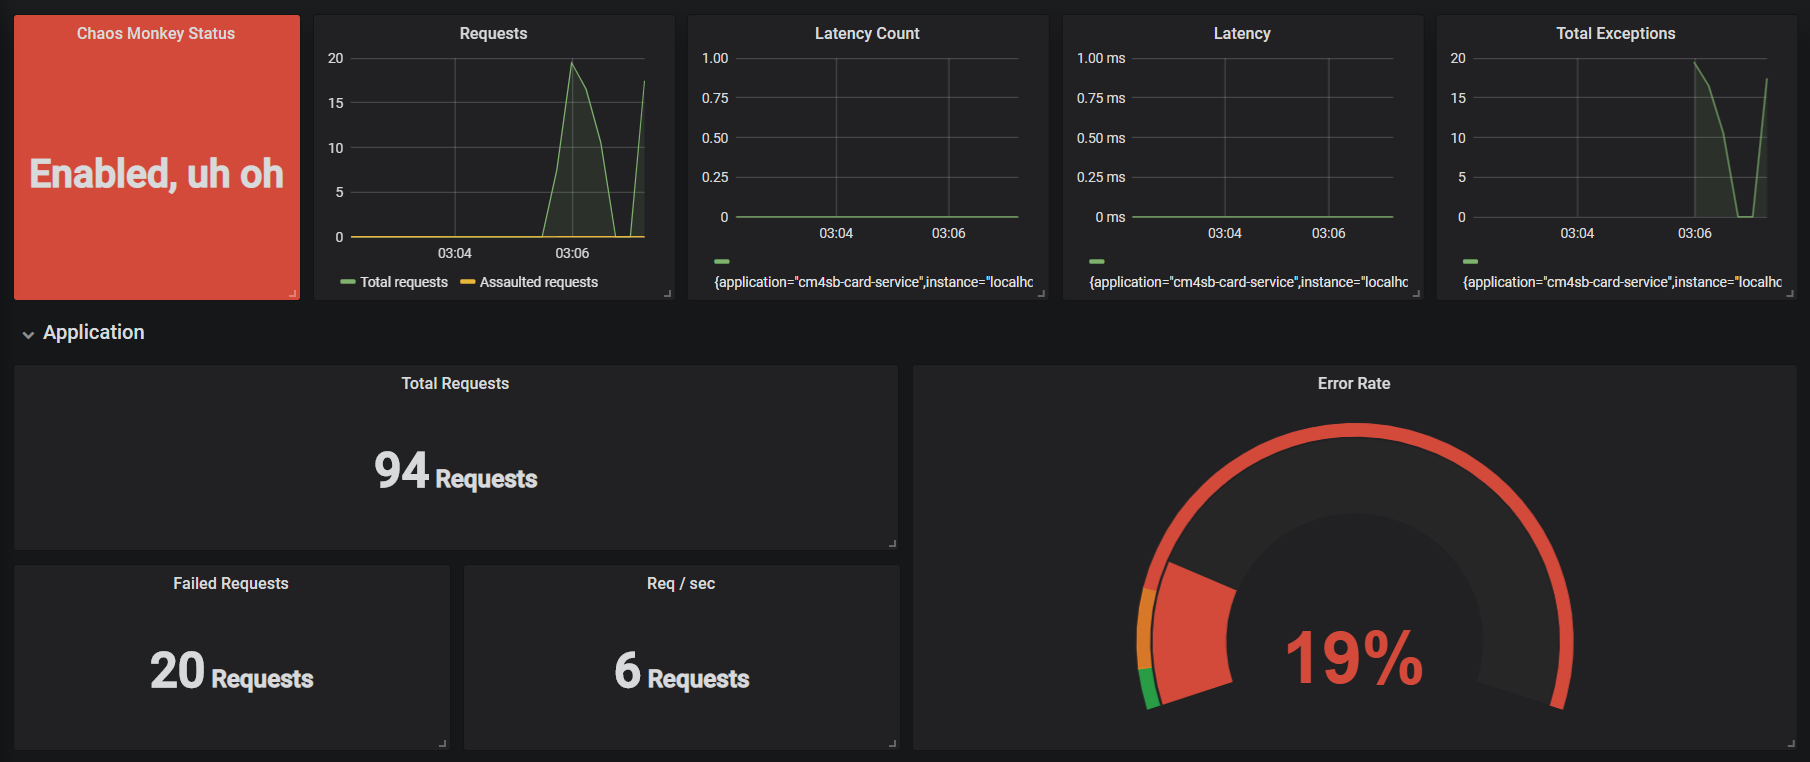
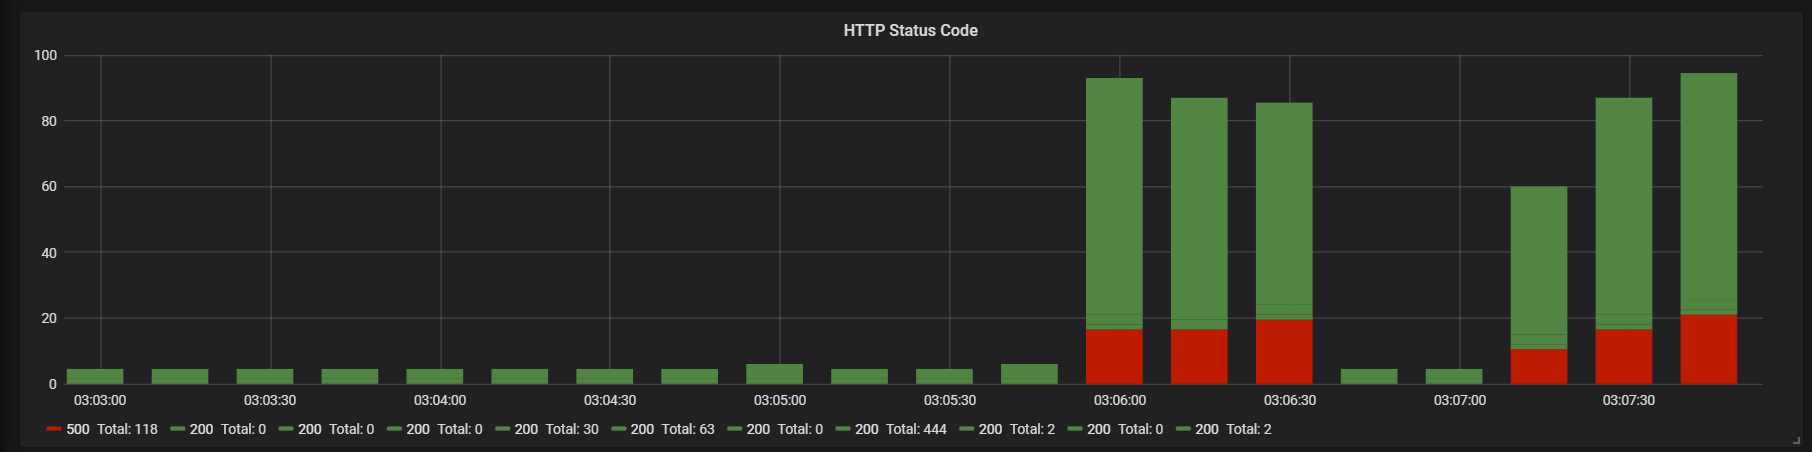
Within HTTP code section of dashboard we can also see number of requests that have ended up with HTTP code as 500 (due to Runtime Exception thrown by CM4SB assault)
Third Chaos Experiment
As part of this chaos experiment we will be applying kill application Assault to understand Card Client behavior in case Card Service inadvertently goes down. So we will change the assault configuration by applying below request payload with same URI as above i.e. '/actuator/chaosmonkey/assaults'
 1{
 2     "level": 5,
 3     "latencyRangeStart": 4000,
 4     "latencyRangeEnd": 6000,
 5     "latencyActive": false,
 6     "exceptionsActive": false,
 7     "killApplicationActive": true,
 8     "exception": {
 9          "type": "java.lang.IllegalArgumentException",
10          "arguments": \[{
11               "className": "java.lang.String",
12               "value": "custom illegal argument exception"
13          }\]
14     }
15}
After running the same tests (i.e. Fetch all Cards using the same above Apache Bench command) we can clearly see that there is not a single failure ! So we can infer that our fallback mechanism that we have configured within Card Client application is working as per its expected behavior in case Card Service becomes unresponsive.
Conclusion
With this 2 part series on Chaos Engineering we were able to understand the fundamentals of Chaos Engineering along with following points -
- Significance of Chaos Engineering in this distributed world
- How to perform chaos in Spring Boot applications
- How to monitor application behavior and derive metrics from it
Due to inevitability of failures in software world, I am sure that you are convinced about the need of a disciplined and an organized way to proactively test system by injecting failures - that discipline is none other than CHAOS ENGINEERING! I would like to end this 2 part series with an apt and famous axiom :
The MORE you SWEAT in PEACE,
the LESS you BLEED in WAR
— Norman Schwarzkopf
which completely resonates with 'Why Chaos Engineering' should be formally inducted as part of (distributed) application development and its production release.
comments powered by Disqus